1. hr 데이터셋 살펴보기
# 라이브러리 불러오기:
import numpy as np
import pandas as pd
import seaborn as sns
import matplotlib.pyplot as plt
데이터 불러오기:
hr_df = pd.read_csv('/content/drive/MyDrive/KDT/6.머신러닝과 딥러닝/Data/hr.csv')
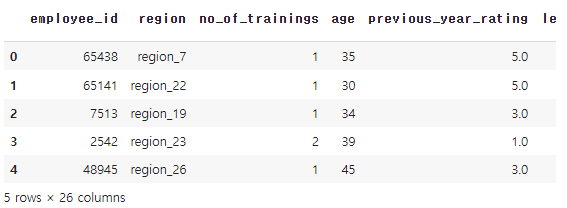
hr_df.head()

hr_df.info()
# 변수 설명:

employee_id: 임의의 직원 아이디
department: 부서
region: 지역
education: 학력
gender: 성별
recruitment_channel: 채용 방법
no_of_trainings: 트레이닝 받은 횟수
age: 나이
previous_year_rating: 이전 년도 고과 점수
length_of_service: 근속 년수
awards_won: 수상 경력
avg_training_score: 평균 고과 점수
is_promoted: 승진 여부
# 데이터 통계 요약:
hr_df.describe()
# 시각화:
# 이전 년도 고과 점수에 따른 승진 비율 막대 그래프

sns.barplot(x='previous_year_rating', y='is_promoted', data=hr_df)
# Seaborn 라이브러리를 사용하여 이전 연도 평가 점수와 승진 여부 사이의 관계를 나타내는 선 그래프를 만듭니다

sns.lineplot(x='previous_year_rating',y='is_promoted', data=hr_df)
# Seaborn 라이브러리를 사용하여 평균 교육 점수와 승진 여부 사이의 관계를 나타내는 선 그래프를 만듭니다

sns.lineplot(x='avg_training_score', y='is_promoted', data=hr_df)
# 채용 방법에 따른 승진 비율 막대 그래프

sns.barplot(x='recruitment_channel', y='is_promoted', data=hr_df)
#hr_df 데이터프레임의 recruitment_channel 열에 있는 각 채용 채널별 채용 건수를 집계합니다.

hr_df['recruitment_channel'].value_counts()
# 성별에 따른 승진 비율 막대 그래프

sns.barplot(x='gender', y='is_promoted', data=hr_df)
# gender 열에서 각 성별의 직원 수를 세는 데 사용됩니다.

hr_df['gender'].value_counts()
sns.barplot(x='department', y='is_promoted', data=hr_df)
plt.xticks(rotation=45)
hr_df['department'].value_counts()
plt.figure(figsize=(14, 10))
sns.barplot(x='region', y='is_promoted', data=hr_df)
plt.xticks(rotation=45)

hr_df.isna().mean()
hr_df['education'].value_counts()
hr_df['previous_year_rating'].value_counts()
hr_df = hr_df.dropna()hr_df.info()
for i in {'department','region','education','gender','recruitment_channel'}:
  print(i,hr_df[i].nunique())
hr_df = pd.get_dummies(hr_df, columns=['department','education','gender','recruitment_channel'])
hr_df.head()
hr_df.drop(['employee_id', 'region'], axis=1, inplace=True)
hr_df.head()
from sklearn.model_selection import train_test_splitX_train, X_test, y_train, y_test = train_test_split(hr_df.drop('is_promoted', axis=1), hr_df['is_promoted'], test_size=0.2, random_state=2024)X_train.shape, X_test.shape
y_train.shape, y_test.shape
2. 로지스틱 회귀(Logistic Regression)
- 둘 중의 하나를 결정하는 문제(이진 분류)를 풀기 위한 대표적인 알고리즘
- 입력 데이터와 가중치의 선형 조합으로 선형 방정식을 만듦 -> 선형 방정식의 결과를 0과 1사이의 확률값으로 변환(시그모이드 함수)
- 3개 이상의 클래스에 대한 판별도 할 수 있음
- OvR(One-vs-Rest): 각 클래스마다 하나의 이진 분류기를 만들고, 해당 클래스를 기준으로 그 클래스와 나머지 모든 클래스를 구분하는 이진 분류를 실행 -> 가장 높은 확률을 가진 클래스를 선택
- OvO(One-vs-One): 클래스의 개수가 N인 경우 (N-1)/2개의 이진 분류기를 만듦 -> 입력 데이터를 각 이진 분류기에 넣어 가장 많이 선택된 클래스를 최종 선택
대부분 OvR 전략을 선호. 클래스 간의 구분이 명확하지 않거나 데이터가 한쪽으로 치우친 경우 OvO를 고려
from sklearn.linear_model import LogisticRegressionlr = LogisticRegression()lr.fit(X_train, y_train)
pred = lr.predict(X_test)from sklearn.metrics import accuracy_score, confusion_matrixaccuracy_score(y_test, pred)
hr_df['is_promoted'].value_counts()
3. 혼돈 행렬(confusion matrix)
TN(8784)        FP(100)
FN(673) TP(175)- TN: 승진하지 못했는데, 승진하지 못했다고 예측
- FN: 승진하지 못했는데, 승진했다고 예측
- FP: 승진했는데, 승진하지 못했다고 예측
- TP: 승진했는데, 승진했다고 예측
confusion_matrix(y_test, pred)
3-1. 정밀도(precision)
- TP / (TP + FP)
- 무조건 양성으로 판단해서 계산하는 방법
- 실제 1인 것중에 얼마 만큼을 제대로 맞췄는가?
3-2. 재현울(recall)
- TP / (TP + FN)
- 정확하게 감지한 양성 샘플의 비율
- 1이라고 예측한 것 중, 얼마 만큼을 제대로 맞췄는가?
- 민감도 또는 TPR (True Positive Rate)라고도 부름
3-3. f1 score
- 정밀도와 재현율의 조화평균을 나타내는 지표
정밀도 재현율 산술평균 조화평균
0.4    0.6    0.5      0.48
0.3    0.7    0.5      0.42
0.5    0.5    0.5      0.5
from sklearn.metrics import precision_score, recall_score, f1_scoreprecision_score(y_test, pred)
recall_score(y_test, pred)
f1_score(y_test, pred)
lr.coef_
# 독립변수 2개, 종속변수 1개
tempX = hr_df[['previous_year_rating', 'avg_training_score', 'awards_won?']]
tempY = hr_df['is_promoted']
temp_lr = LogisticRegression()temp_lr.fit(tempX, tempY)
temp_df = pd.DataFrame({
    'previous_year_rating': [4.0, 5.0, 5.0],
    'avg_training_score': [100, 90, 100],
    'awards_won?': [0, 0, 1]
})
temp_df
pred = temp_lr.predict(temp_df)
pred
temp_lr.coef_ # 기울기
temp_lr.intercept_ # 기울기
proba = temp_lr.predict_proba(temp_df)
proba
# 임계값 설정
# 기본 임계값은 0.5

threshold = 0.5
pred = (proba > threshold).astype(int)
pred
4. 교차 검증(Cross Validation)
- train_test_split에서 발생하는 데이터의 섞임에 따라 성능이 좌우되는 문제를 해결하기 위한 기술
- K겹(K-Fold) 교차 검증을 가장 많이 사용
from sklearn.model_selection import KFoldkf = KFold(n_splits=5)
kf
hr_df
for train_index, test_index in kf.split(range(len(hr_df))):
    print(train_index, test_index, len(train_index), len(test_index))
kf = KFold(n_splits=5, random_state=10, shuffle=True)
kf
for train_index, test_index in kf.split(range(len(hr_df))):
    print(train_index, test_index, len(train_index), len(test_index))
# KFold(n=5)를 사용하여 위 데이터를 LogisticRegression 모델로 학습을 시키고
 #각 n마다 예측결과를 accuracy_score 값으로 출력

 # KFold(n=5)를 사용하여 위 데이터를 LogisticRegression 모델로 학습을 시키고
 #각 n마다 예측결과를 accuracy_score 값으로 출력

acc_list = []

for train_index, test_index in kf.split(range(len(hr_df))):
    X = hr_df.drop('is_promoted', axis=1)
    y = hr_df['is_promoted']

    X_train = X.iloc[train_index]
    X_test = X.iloc[test_index]
    y_train = y.iloc[train_index]
    y_test = y.iloc[test_index]

    lr = LogisticRegression()
    lr.fit(X_train, y_train)
    pred = lr.predict(X_test)
    acc_list.append(accuracy_score(y_test, pred))
acc_list
np.array(acc_list).mean()
크로스 벨리데이션을 사용하는 이유는 결과를 좋게 하기 위함이 아니라 믿을만한 검증을 하기 위함
'머신러닝 & 딥러닝' 카테고리의 다른 글
| 9. 랜덤 포레스트 (0) | 2024.06.12 |
|---|---|
| 8. 서포트 벡터 머신 (2) | 2024.06.12 |
| 6. 의사 결정 나무 (1) | 2024.06.11 |
| 5. 선형 회귀 (0) | 2024.06.11 |
| 4. 타이타닉 데이터셋 (0) | 2024.06.10 |


